

Election Control Center

Election Forecasts

Compare the major election maps in one place. Each forecast combines a control threshold, baseline map, toss-up pool, race notes, and a direct path into the interactive editor.

4
Active Maps
103
Toss-up Units
Governor
Closest Balance
Featured race
2028 Presidential Map

Start from the 2024 result, move battleground states, and test which coalition reaches 270.

Open 2028 Forecast
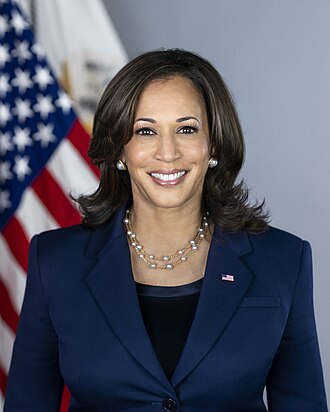
Kamala Harris
2028 Electoral College

President Forecast

The early presidential baseline starts with both parties short of 270 and a compact battleground set deciding the map.

270 electoral votes
D 226
226
81
231
R 231
Key races
PennsylvaniaMichiganWisconsinGeorgiaArizonaNevada
Control math

The winner needs 270 of 538 electoral votes.

Jon Ossoff
2026 Chamber Control

Senate Forecast

Republicans begin with the clearer control position, while Democrats need a near-perfect defensive map plus pickups.

51 seats
D 47
47
53
R 53
Key races
GeorgiaNorth CarolinaMaineMichiganTexasIowa
Control math

A party usually needs 51 seats, or 50 with the vice presidency.

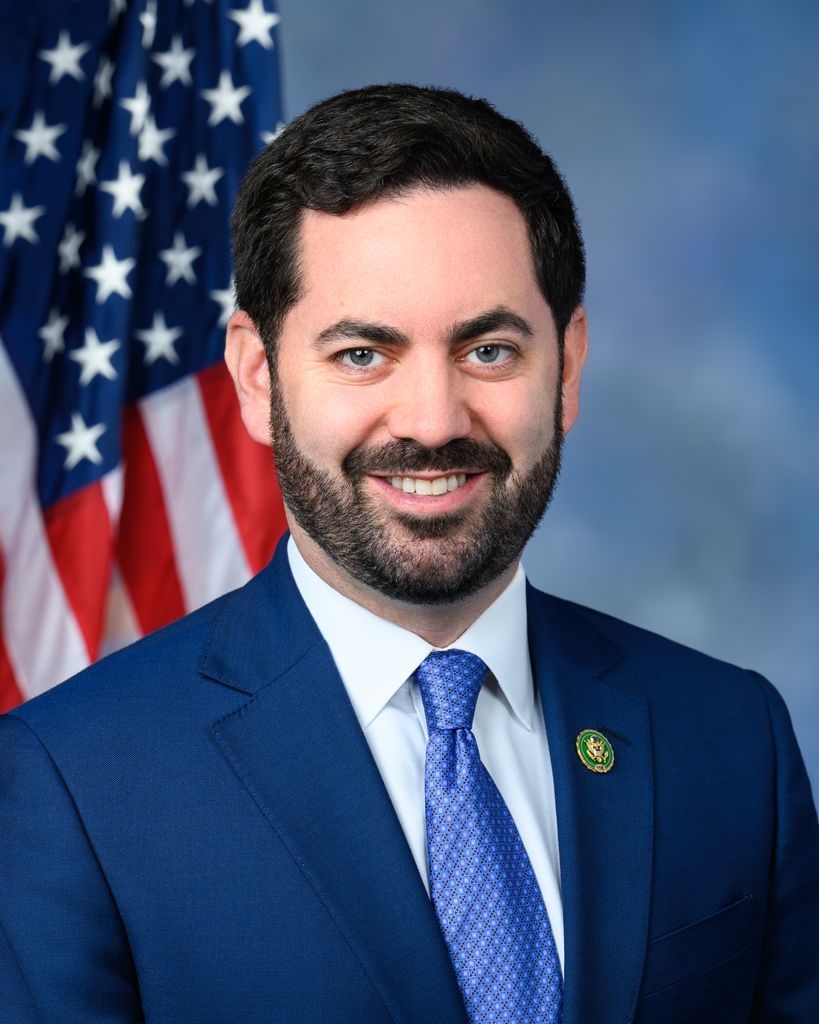
Mike Lawler
2026 District Map

House Forecast

The House forecast is built around a narrow majority environment where a small group of crossover and suburban seats can decide control.

218 seats
D 213
213
18
204
R 204
Key races
NY-17WA-03PA-01CA-22NC redrawFrontline suburbs
Control math

A majority requires 218 seats when all 435 seats are filled.

Republican Party logo
2026 State Executives

Governor Forecast

The governor map is balanced, with control hinging on a few open seats and states where federal partisanship does not fully predict outcomes.

26 governorships
D 23
23
4
23
R 23
Key races
GeorgiaMichiganNevadaWisconsinArizonaPennsylvania
Control math

A party needs 26 governorships for a national majority.