
U.S. Presidential Election
2028 Presidential Election Forecast
An electoral college forecasting dashboard with map controls, contender headshots, party logos, ratings and market-style probabilities for the road to 270.
Interactive Map Projection
Start from the 2024 result or a blank map, then build your own path to 270.
Electoral College Projection
Modeled baseline with competitive states held as toss-ups.
Presidential Forecast Workspace
Choose a presidential cycle. Each tab uses the same forecast table format.
2028 Presidential Contender Table
Filter by rating category. Probability shows modeled nomination/general-election strength.
| Base | Photo | Candidate | Party | Since | Term | Consensus | Prediction market |
|---|---|---|---|---|---|---|---|
| CA | 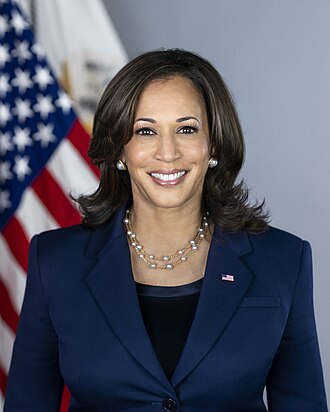 | Kamala Harris |  Democratic Democratic | 2021 | 1 | Toss-Up | 18% |
| CA | 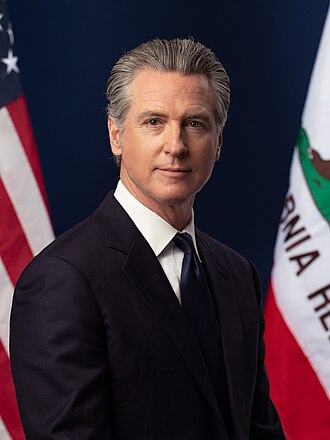 | Gavin Newsom | Democratic | 2019 | 2 | Lean | 17% |
| MI |  | Gretchen Whitmer | Democratic | 2019 | 2 | Lean | 11% |
| PA | 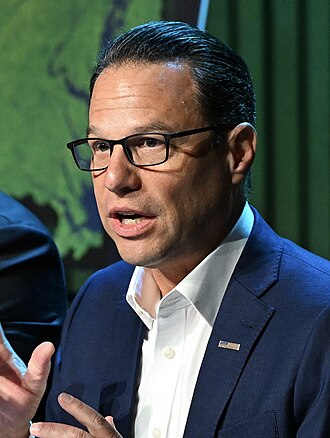 | Josh Shapiro | Democratic | 2023 | 1 | Tilt | 9% |
| IN |  | Pete Buttigieg | Democratic | 2021 | 1 | Tilt | 7% |
| OH |  | JD Vance |  Republican Republican | 2025 | 1 | Likely | 24% |
| FL | 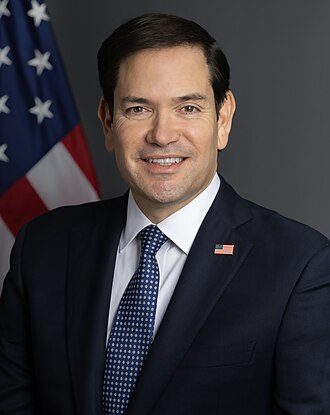 | Marco Rubio | Republican | 2025 | 1 | Lean | 16% |
| FL | 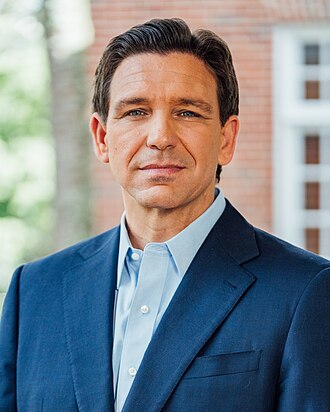 | Ron DeSantis | Republican | 2019 | 2 | Lean | 10% |
| SC | 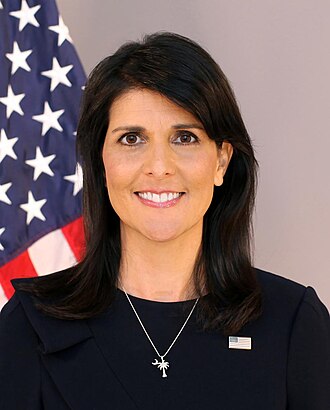 | Nikki Haley | Republican | 2011 | 2 | Tilt | 6% |
| OH | 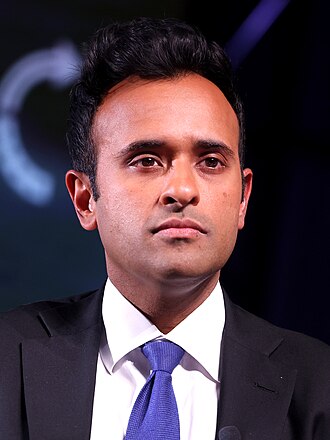 | Vivek Ramaswamy | Republican | 2025 | 1 | Tilt | 5% |
Market Signal
Modeled probability bands for the White House.
Frequently Asked Questions
How many electoral votes are needed to win?
A presidential candidate needs at least 270 of the 538 electoral votes to win.
Are these official presidential candidates?
No. This dashboard is an early forecasting interface using modeled contenders and probabilities until the official field is settled.
Can I share my 2028 forecast?
Yes. Open the full interactive map and use the Share button to generate a link or embed code.