
U.S. House Elections
2026 House Election Forecast
A House control dashboard with a district map, competitive race table, candidate headshots, party logos, consensus ratings and market-style probabilities.
Interactive Map Projection
Click into the full map to assign districts and build a custom House control forecast.
National House Control Projection
Modeled seat balance with the closest races held as toss-ups.
House Forecast Workspace
Choose a House election year. Each tab uses the same forecast table format.
2026 House Race Table
Filter by rating category. Probability shows the candidate or incumbent party's modeled edge.
| District | Photo | Candidate | Party | Since | Term | Consensus | Prediction market |
|---|---|---|---|---|---|---|---|
| CA-22 | 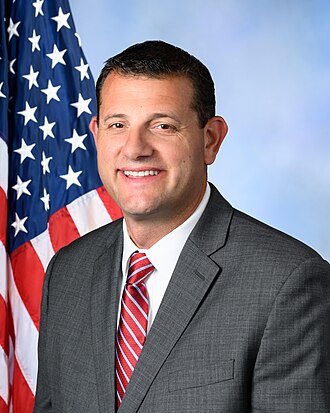 | David Valadao |  Republican Republican | 2021 | 3 | Toss-Up | 50% |
| NY-17 |  | Mike Lawler | Republican | 2023 | 2 | Toss-Up | 51% |
| WA-03 | 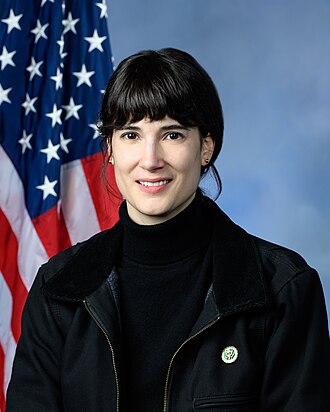 | Marie Gluesenkamp Perez |  Democratic Democratic | 2023 | 2 | Toss-Up | 50% |
| NE-02 | DB | Don Bacon | Republican | 2017 | 5 | Toss-Up | 49% |
| VA-02 | JK | Jen Kiggans | Republican | 2023 | 2 | Lean | 54% |
| PA-01 |  | Brian Fitzpatrick | Republican | 2017 | 5 | Lean | 57% |
| PA-10 | SP | Scott Perry | Republican | 2013 | 7 | Tilt | 53% |
| PA-07 | RM | Ryan Mackenzie | Republican | 2025 | 1 | Toss-Up | 50% |
| IA-01 | MMM | Mariannette Miller-Meeks | Republican | 2021 | 3 | Tilt | 52% |
| CO-08 | GE | Gabe Evans | Republican | 2025 | 1 | Toss-Up | 50% |
| NY-04 | 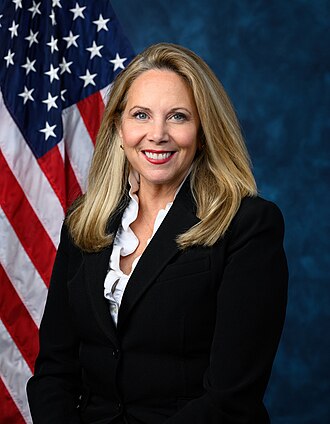 | Laura Gillen | Democratic | 2025 | 1 | Lean | 56% |
| ME-02 | JG | Jared Golden | Democratic | 2019 | 4 | Toss-Up | 51% |
Market Signal
Modeled probability bands for House control.
Frequently Asked Questions
How many seats are needed to control the House?
The House has 435 voting seats, so a party needs 218 seats for a majority.
Are all House seats up in 2026?
Yes. Every voting House seat is elected every two years.
Can I share my House forecast?
Yes. Open the full interactive map and use the Share button to generate a link or embed code.